GM Q3 2023 earnings were headlined by $3.1 billion in net income on $44 billion in revenue. Compared to the third quarter of 2022, the results represent a 7.3 percent decrease in net income and 5.4 percent increase in revenue.
GM Q3 2023 Earnings Summary
| METRIC | UNIT | Q3 2023 | Q3 2022 | CHANGE | % CHANGE |
|---|---|---|---|---|---|
| GAAP METRICS | |||||
| NET REVENUE | BILLION USD | $44,131 | $41,889 | $+2,242 | +5.4% |
| NET INCOME ATTRIBUTED TO STOCKHOLDERS | BILLION USD | $3,064 | $3,305 | $-241 | -7.3% |
| NET INCOME MARGIN | PERCENT | 6.9% | 7.9% | -1.0 ppts | -12.7 |
| EARNINGS PER SHARE (EPS) DILUTED1 | USD PER SHARE | $2.20 | $2.25 | $-0.05 | -2.2% |
| NON GAAP METRICS | |||||
| EBIT-ADJUSTED | BILLION USD | $3.56 | $4.29 | $-0.7 | -17% |
| EBIT-ADJUSTED MARGIN | PERCENT | 8.1% | 10.2% | -2.1 ppts | -20.6% |
| AUTOMOTIVE OPERATING CASH FLOW | BILLION USD | $6,794 | $6,502 | $292.0 | +4.5% |
| ADJUSTED AUTOMOTIVE FREE CASH FLOW | BILLION USD | $4,910 | $4,593 | +317 | +6.9% |
| EPS DILUTED - ADJUSTED1 | BILLION USD | $2.28 | $2.25 | $+0.0 | +1.3% |
| DELIVERIES | MILLIONS OF VEHICLES | 1,619 | 1,539 | 80 | +5.2% |
| MARKET SHARE (IN GM MARKETS) | PERCENT | 9.2% | 9.1% | +0.1 ppts | N/A |
| DIVISIONAL RESULTS | |||||
| GM NORTH AMERICA EBIT-ADJUSTED | BILLION USD | $3,526 | $3,894 | $-368 | -9.5% |
| GM INTERNATIONAL EBIT-ADJUSTED | MILLION USD | $357 | $334 | $+23 | +6.9% |
| GM CHINA EQUITY INCOME | MILLION USD | $192 | $330 | $-138 | -41.8% |
| CRUISE EBIT-ADJUSTED | MILLION USD | $500 | $700 | $-200 | -28.6% |
| GM FINANCIAL EBT-ADJUSTED | MILLION USD | $741 | $911 | $-170 | -18.7% |
Earnings
Earnings Before Interest and Taxes, adjusted (EBIT-adjusted) was $3.5 billion, down 16.9 percent or $723 million compared to the $4.28 billion during the year-ago quarter. Net income margin was 6.9 percent, down 1 percentage point, and EBIT-adjusted margin was 8.1 percent, down 2.1 percentage points versus 10.2 percent during the third quarter of 2022.
GM attributes the $723 million drop in EBIT-adjusted to lower mix, higher variable costs, Cruise, and a normalization in GM Financial Earnings Before Taxes. These headwinds were partially offset by continued strong pricing and higher volume.
Global Sales & Share
GM recorded 1,619 million vehicle deliveries globally during the quarter, up five percent or around 80K units year-over-year compared to the 1,539 million delivered during the same time frame a year ago.
GM’s global market share in the markets where it competes was 9.1 percent during Q3 2023, down 0.1 basis points from 9.2 percent during the same time period a year ago.
The increase in deliveries was driven by improved supply chain conditions at GM North America (GMNA), but was partially offset by the intensified market competition in China.
GM North America
GM North America (GMNA), General Motors’ largest and most profitable division, posted:
- $36.1 billion in revenue vs. $34.7 billion in the year-ago quarter
- $3.5 billion EBIT-adjusted vs. $3.9 billion in the year-ago quarter
- 796K vehicle deliveries vs. 663K in the year-ago quarter
- U.S. dealer inventory was at 443K units vs. 359K in the year-ago quarter
- U.S. GM EV sales totaled 20.1K units for 6.6 percent market share vs. 15.2K units and 8.3 percent market share in the year-ago quarter
GM International
GM International (GMI), which excludes GM China joint venture earnings, posted:
- $4.3 billion in revenue vs. $4.0 billion in the year-ago quarter
- $0.2 billion EBIT-adjusted for an EBIT-adjusted margin of 3.8 percent vs. $0.0 billion and an EBIT-adjusted margin of 0.1 percent in the year-ago quarter
- This was driven by price favorability and mix, but was partially offset by manufacturing, logistics and other costs
- 171K vehicle wholesales vs. 182K in the year-ago quarter
GM China Auto Joint Venture
GM China auto joint venture posted:
- $7.9 billion in revenue vs. $10.4 billion in the year-ago quarter
- $0.2 billion in equity income vs. $0.3 billion in the year-ago quarter
- The decline was driven by lower volume and continued pricing pressure in the very competitive China market, partially offset by cost initiatives
- 796K vehicle wholesales vs. 1,007K in the year-ago quarter
GM Cruise
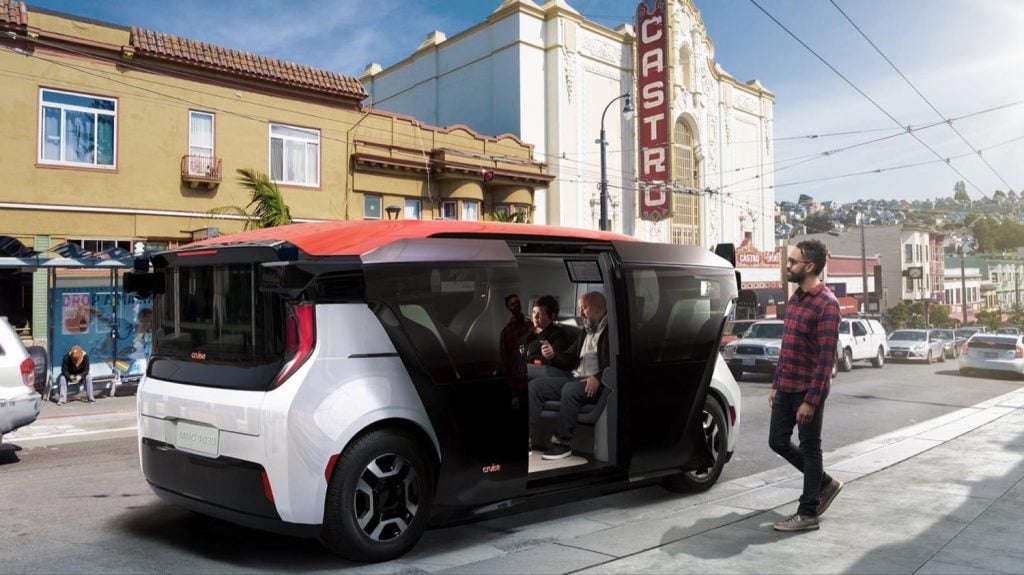
Cruise, GM’s division that’s working on developing and bringing to market a robo-taxi service, posted:
- $0.0 billion in revenue vs. $0.0 billion in the year-ago quarter
- $(0.7) billion in EBIT-adjusted vs. $(0.5) billion in the year-ago quarter on increased expenses driven by rapid operational scaling
GM Financial
GM Financial, General Motors’ captive finance arm, posted:
- $0.7 billion EBT-adjusted and an 18 percent Return on Average Tangible Common Equity (RATCE) vs. $0.9 billion and 27.9 percent RATCE in the year-ago quarter
- $28.7 billion in liquidity and 8.16x Leverage Ratio vs. $27.3 billion and 7.68x Leverage Ratio in the year-ago quarter
- $115.0 billion in ending earning assets vs. $106.7 billion in the year-ago quarter
- GM Financial accounted for 40.8 percent of GM U.S. retail sales (by units) vs. 42.9 percent in the year-ago quarter
Guidance
Though the Detroit-based automaker did not comment on the ongoing 2023 GM-UAW labor negotiations, it did provide some insight about what investors and analysts should expect in the future:
- Improvements in cost structure, with the company on track to achieve net $2 billion fixed cost reduction program by 2024
- Launching strong products in strategic segments to maintain margins in a competitive environment
- Matching EV supply with demand to maintain strong pricing while taking immediate steps to enhance the profitability of GM’s EV portfolio
- Targeting low to mid single-digit EBIT EV margin in 2025
- Battery cell production continues to ramp up at the Ultium Cells Ohio plant and is expected to reach full capacity by the end of 2023
- GM expects to have annual EV capacity of 1 million units in North America toward the end of 2025. This comes as GM abandons plans to build 400K EVs by mid-2024 in North America
We will continue our obsessive coverage of all things General Motors, and invite you to subscribe to GM Authority for more GM financial news, GM business news, and around-the-clock GM news coverage.


Comments
Now the union will be crying for more.
Union deserves more & shareholders less. Unfortunately, the US allowed non union import brands to flood US as a sort of mega union bust.
Uneducated workers in Tennessee voted down a union VW was fine with because of fear and 40 years of political anti organized labor GOP brainwashing. Wealth doesn’t trickle down without a union
Big icebergs ahead. EV production/sales. UAW pay raises. Lower cost competitors. Is Mary captain of the Titanic in the industry?
I hope Mary can turn the ship around. Right now Mary Barra looks like the Kathleen Kennedy of the auto industry.
These results are solid but when summarized we have increased sales volume but DECREASED net profit and also a slight reduction in market share. The 2023 net profit % is 1 full percentage point lower than a year earlier and BEFORE this new UAW contract takes effect (whatever it is it will increase labor costs above current levels). With rising vehicle prices (due to the increased costs) and rising interest rates on car loans (which could hurt volumes) the next quarter results for GM will not be as good as this quarter. The UAW needs to be careful as it continues to squeeze this golden goose.
–
GM and Mary have done well in tough times. But things will continue to get tougher.
I expect more cuts in plants and in some other areas in the companies.
Unless the government backs off with the EPA and CARB investment will still be in in EV models. Don’t expect Carb to back off.
“GM recorded 1,619 million vehicle deliveries globally during the quarter,”
You mean 1,619 thousand vehicle deliveries, or 1.619 million.
I appreciate the fact that GM Authority posted all the numbers that are part of GM’s profits. All to often the media will post a corporation’s profits, without ever mentioning what the total sales were verses the profit, or what the percentage of sales the profit represented. This is especially true when they’re reporting on some of the more hated US companies, like GM and Exxon. This is something most people don’t know, and the media will never tell them, most companies operate on a profit of 4 – 8 percent.
While $3 billion sounds like a lot of money, and it is, it cost GM $41 billion dollars to make just $3 billion. Even after deductions, the federal government probably made 3 times as much in taxes on GM’s $44 billion in sales, then GM themselves did. Think about that, and remember it the next time some talking head on the evening news complains about some corporation’s massive profits. It takes a lot of money just to make a little.
Mary got ahead of the consumer w/EV. Aside from Tesla no one is thriving on the space, Lucid is in financial peril, and EV buyers will never cross shop Chevy or Cadillac against Tesla.
GM needs a new EV strategy. Buick earns money but amongst shoppers younger than 40 has no name recognition. It’s a perfect brand to sell imported Chinese EVs that require no addition investment
So, if gm makes $3.53 BILLION this past quarter here in North America and only $192 MILLION in China, then only $357 MILLION everywhere else in the world…
WHY IS THE US BEING FORCED INTO EVs FOR THESE SMALLER MARKETS???
You answered your own question. Because EV’s are in higher demand in those markets and GM needs to make them to stay relevant.